Chicago Crime Data Visualization

This project was inspired out of a curiosity for assessing crime rates throughout Chicago’s various different neighborhoods. Using Tableau, R statistical analysis, and the 2012 – 2016 crime data from Kaggle__, my team and I investigated the different types of crimes that occurred, the arrest rates, and the frequency and time of year they took place. This investigation covered 3 different techniques for analyzing the crime dataset: exploratory graphs (dot plots, bar charts and treemaps), time series (line plots and heat maps), and geographical graphs.
Here is what we found out:
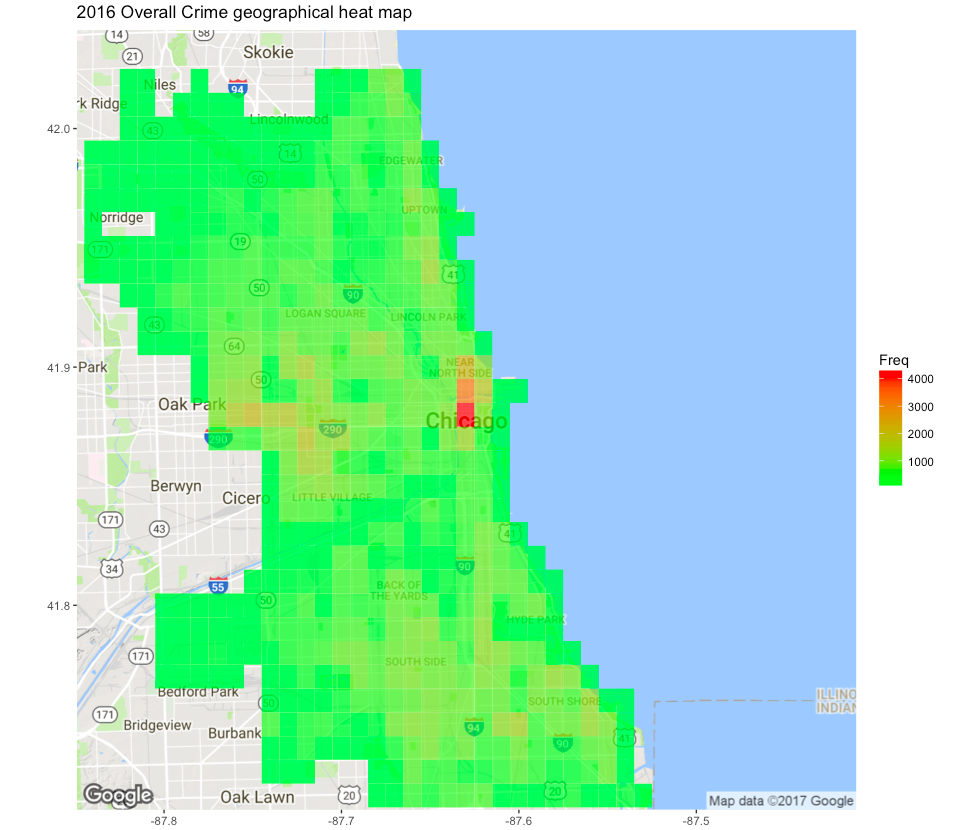
- Crime Hot Spots: downtown, southside, and area between Oak Park and Downtown
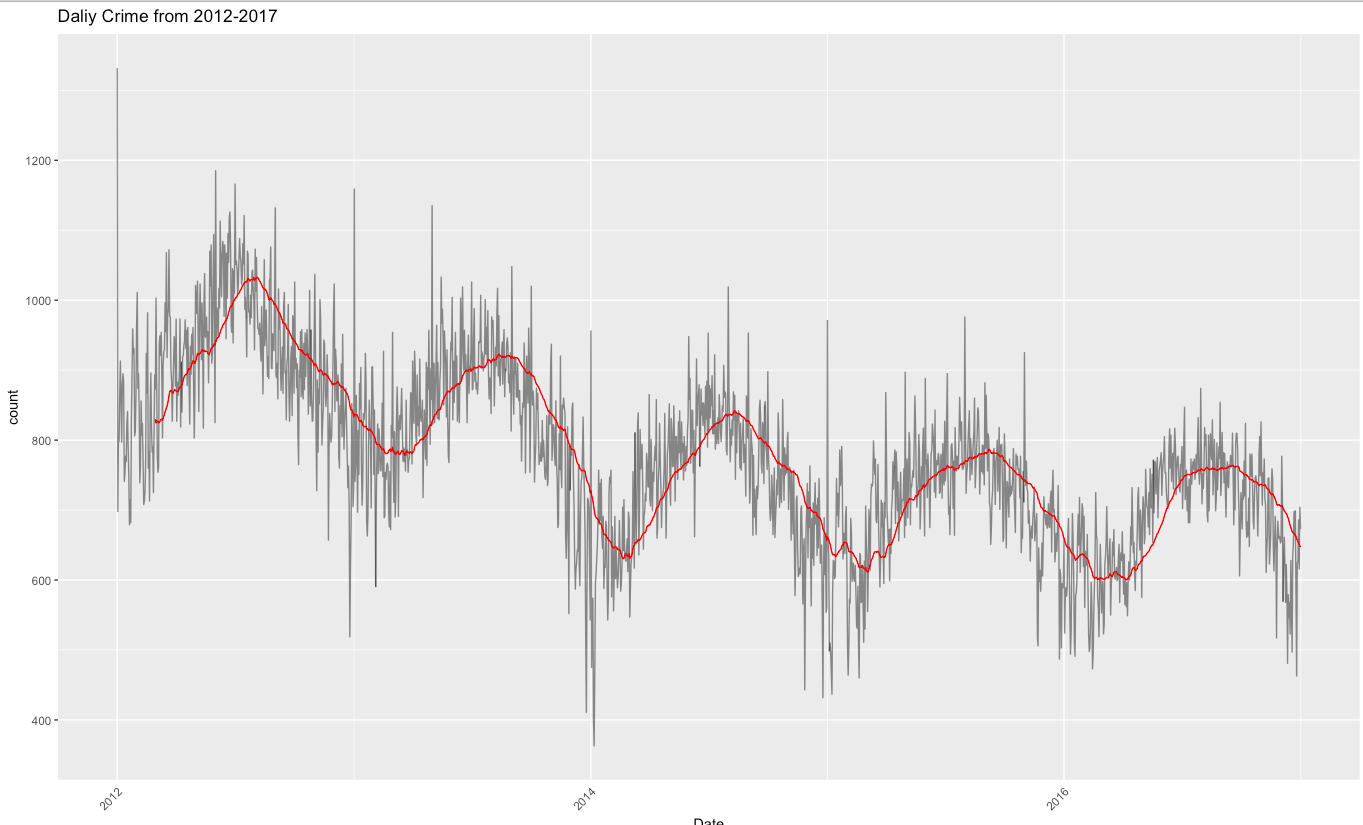
- Overall crime in Chicago has declined from 2012 to 2016
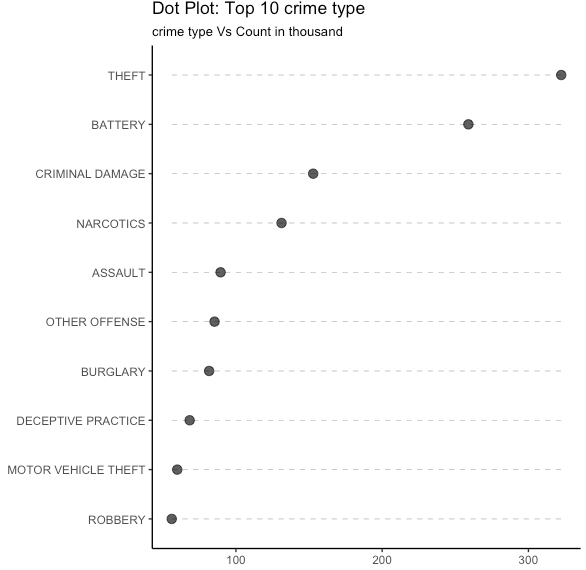
- Top crime types committed were theft and battery
- Recurring high crime rate during the summer periond (June - August) every year
You can learn more about the results and codes at my GitHub Portfolio.